The StochRSI trading indicator is a timing indicator.
- Benjamin Johnson
- May 12, 2024
- 1 min read

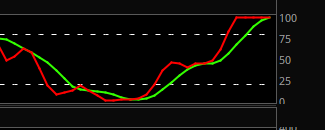
Right now, the Dow Futures and Nasdaq Futures daily charts are at the 100% levels on the StochRSI. I use the StochRSI indicator as my timing indicator. It's considered a high risk trade to try to do a long term trade using the daily charts as a decision chart. I am starting to look to play the down movement when it happens. The market calendar says to look for heavy profit taking from May 10 through May 20. When the stock market is working with the market calendar, you trade boldly in that direction! When the stock market is not working according to the market calendar, you trade cautiously or you do not trade at all.
The Futures daily charts on the StochRSI indicator.

Comments